The activity panel appears on the right side of the screen and shows real-time updates as Doe works on your request.
What You See
- Step timeline - Actions Doe is taking in chronological order
- Current activity - What’s happening right now (“Searching Gmail…”, “Running code…”)
- Thinking blocks - Doe’s reasoning process
- Code execution - Python code and visualizations
- Sub-agents - Specialized agents handling delegated tasks
Expand, collapse, or hide the panel anytime without affecting Doe’s work.
Reading the Timeline
Each step shows a visual indicator:
| Indicator | Meaning |
|---|
| Solid dot | Completed successfully |
| Spinning loader | Currently in progress |
| Faded dot | Queued, not started |
| Timer | Elapsed time |
Thinking Blocks
When you see “Thinking…”, Doe is working through extended reasoning: planning the approach, considering which tools to use, analyzing results, and deciding whether to delegate work.
Click any thinking block to expand the full thought process and see the token count. Longer thinking blocks are normal for complex requests.
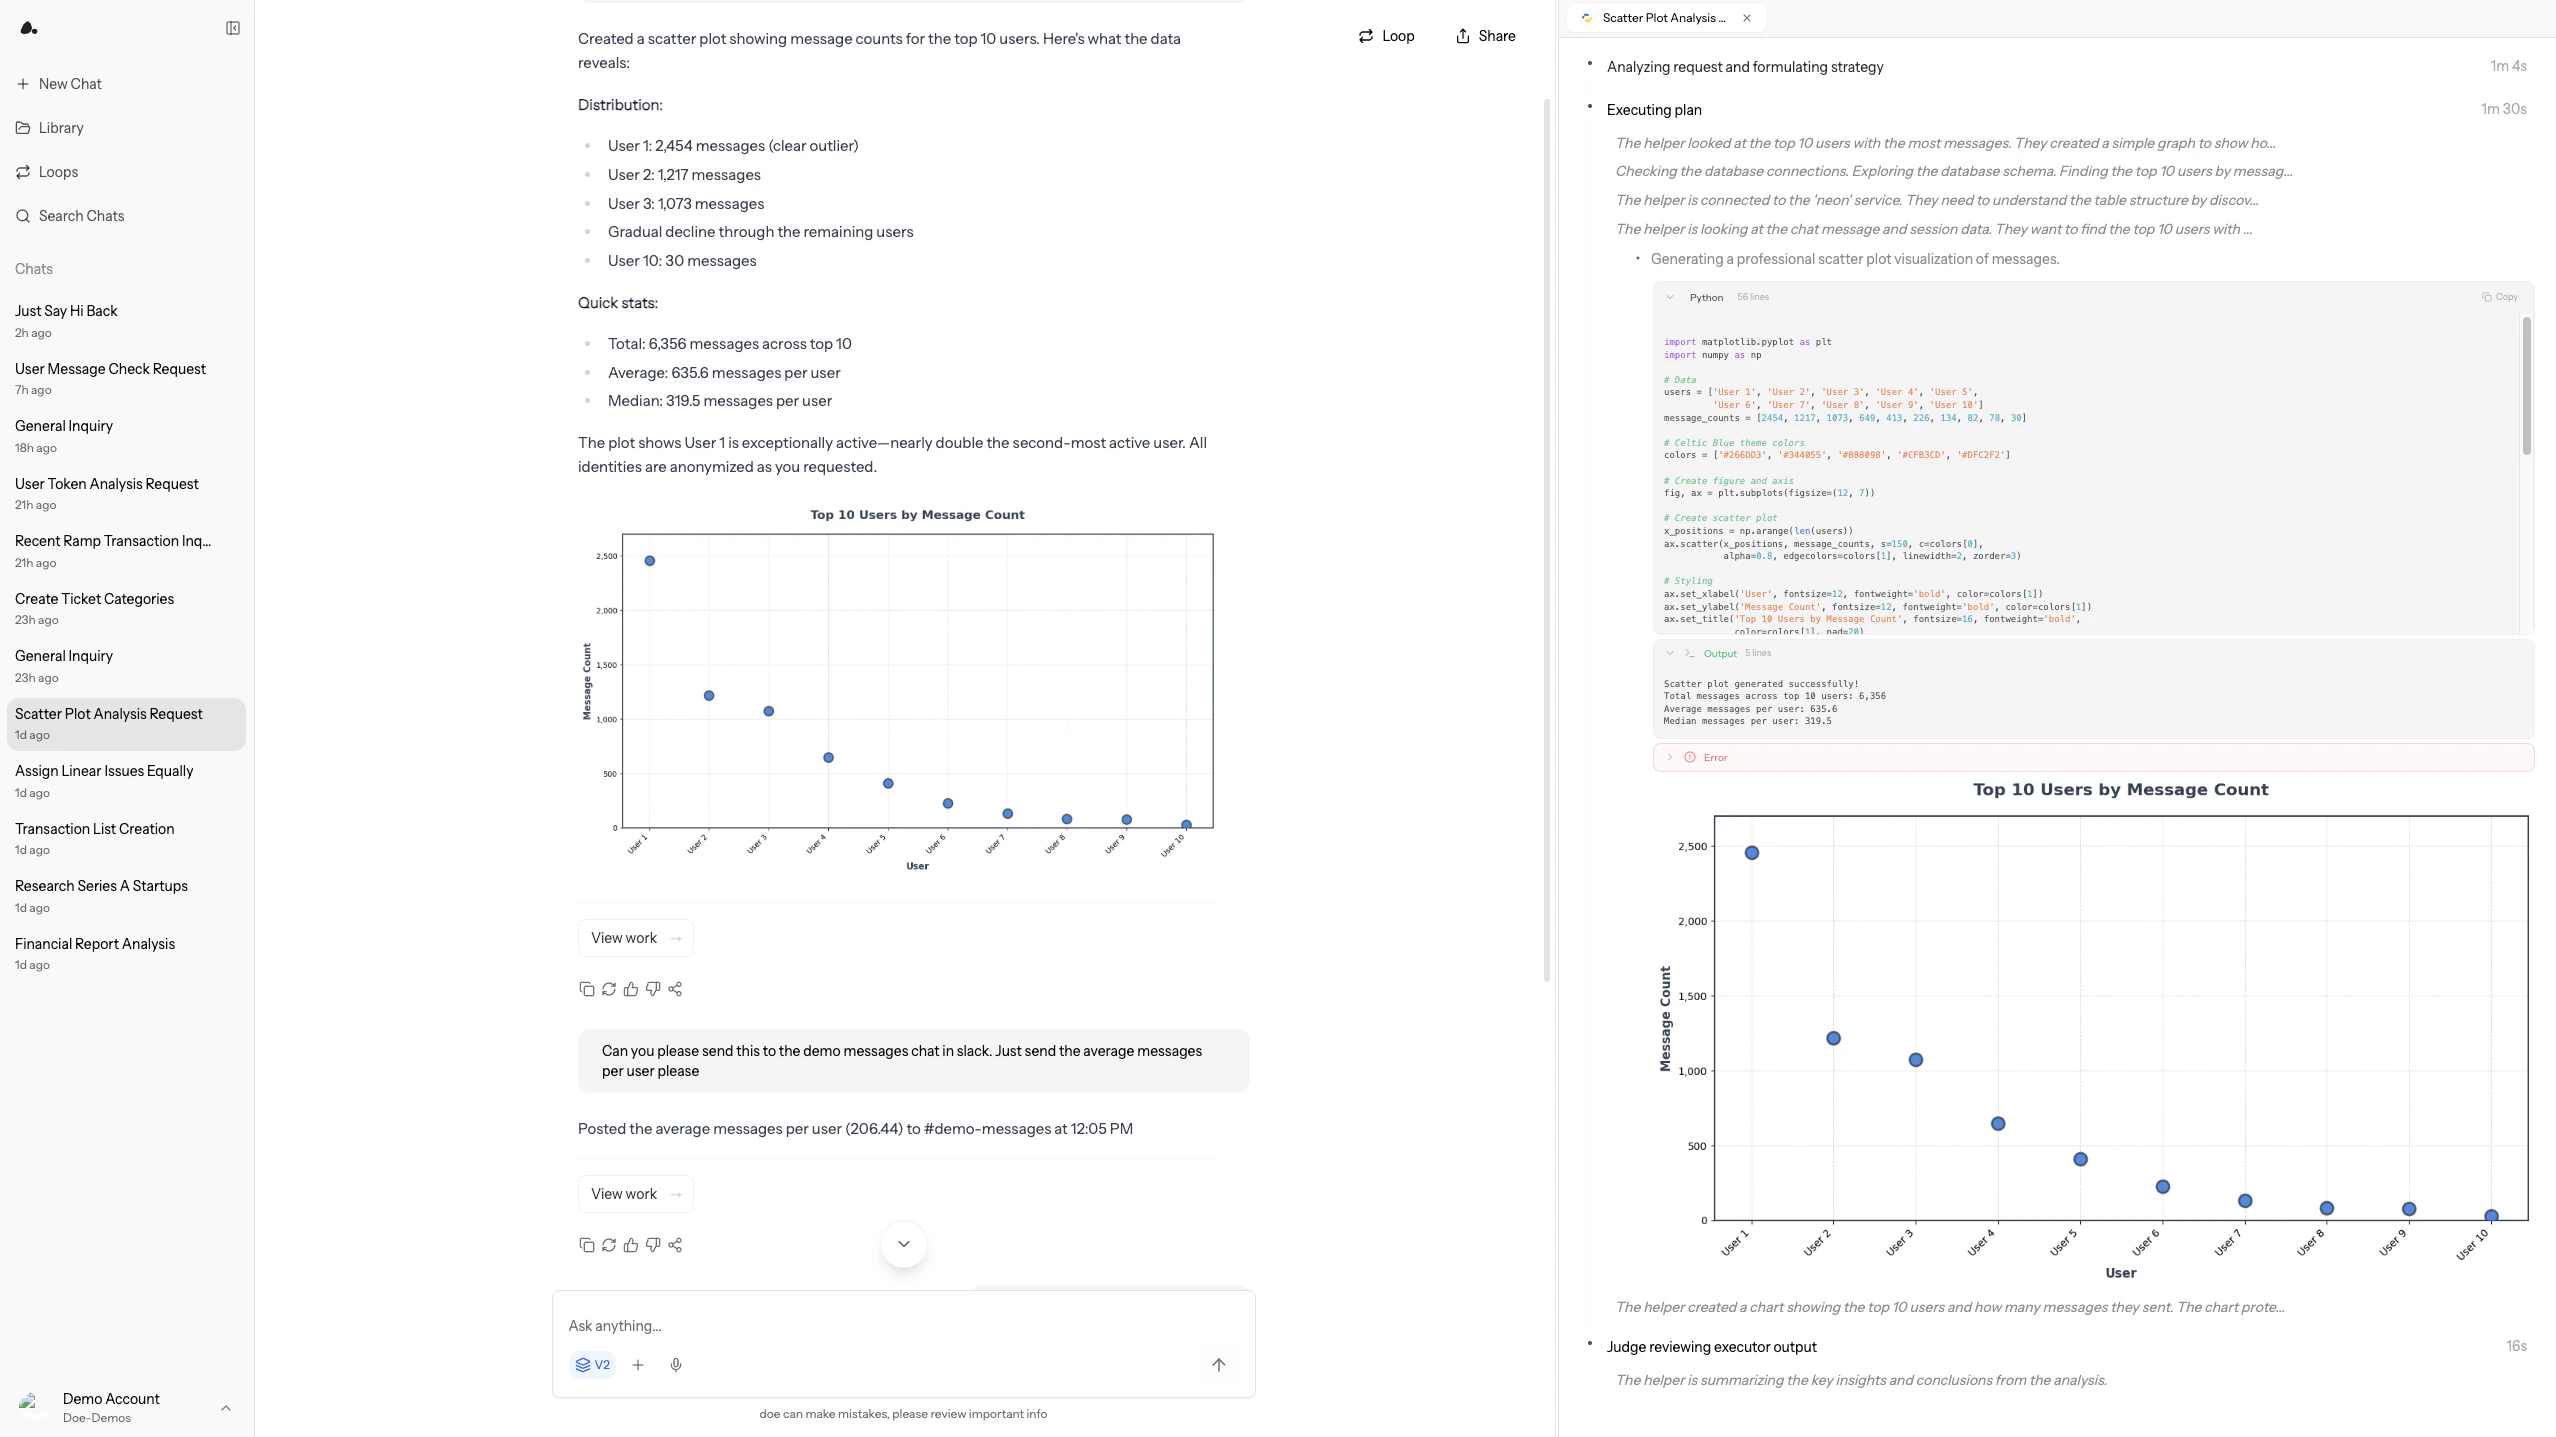
Code Execution & Visualizations
When Doe analyzes data or creates charts, it writes and executes Python code. You’ll see syntax-highlighted code, execution status, output, and duration.
Charts render immediately after execution. Click any chart to view fullscreen (press Escape to close). Interactive charts support zoom, pan, and hover tooltips.
Sub-Agents
For complex tasks, Doe delegates work to specialized sub-agents. These appear as branches in the timeline:
| Indicator | Status |
|---|
| Blue spinner | Actively working |
| Green checkmark | Completed successfully |
| Red X | Encountered an error |
| Gray circle | Queued |
Detailed Drawer View
Click the compact activity indicator at the top of the chat to open the detailed drawer with five collapsible sections:
- Timeline - Chronological event sequence with status icons
- Thinking - All thinking blocks with token counts
- Tools - All tool calls with execution status and duration
- Sub-Agents - Complete list with status, tools used, and errors
- Technical Details - Current phase, token usage, and progress percentage
Timing Expectations
Normal execution times vary by complexity:
- Quick (5-15 seconds) - Simple queries, document summaries, basic charts
- Moderate (30-60 seconds) - Multi-source queries, complex analysis, large files
- Longer (1-3 minutes) - Very large files, multi-step workflows with sub-agents
Next Steps